Overview
Diagram
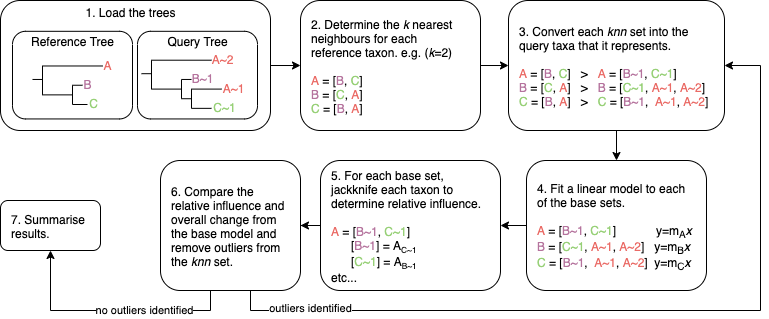
Explanation
Model
Estimator
Regression models (\(y=mx+c\)) are fit using the Theil-Sen estimator. The intercept is assumed to be \(c=0\) as we would expect points around the \(y \approx x \approx 0\) region to be very good representations of correlation between the query and reference trees. This greatly simplifies the estimator to:
Let \(TS_i\) be the the Theil-Sen estimate for each data point \(i\):
The Theil-Sen estimate of the gradient is then \(m = \text{median}(TS)\) for the set \(TS\).
Coefficient of determination
The correlation coefficient \(R^2\) is calculated as follows, where \(\hat{y}\) is the estimate, and \(\bar{y}\) is the mean:
Mean squared error
The mean squared error (MSE) is typically reported as the normalised mean squared error (nMSE). The nMSE is normalised by the standard deviation of the predictor as follows, where \(\sigma\) is standard deviation:
Relative influence function
The relative influence of jackknifing a query taxon \(u_i\) from the full set of taxa size \(n\) is calculated as follows: